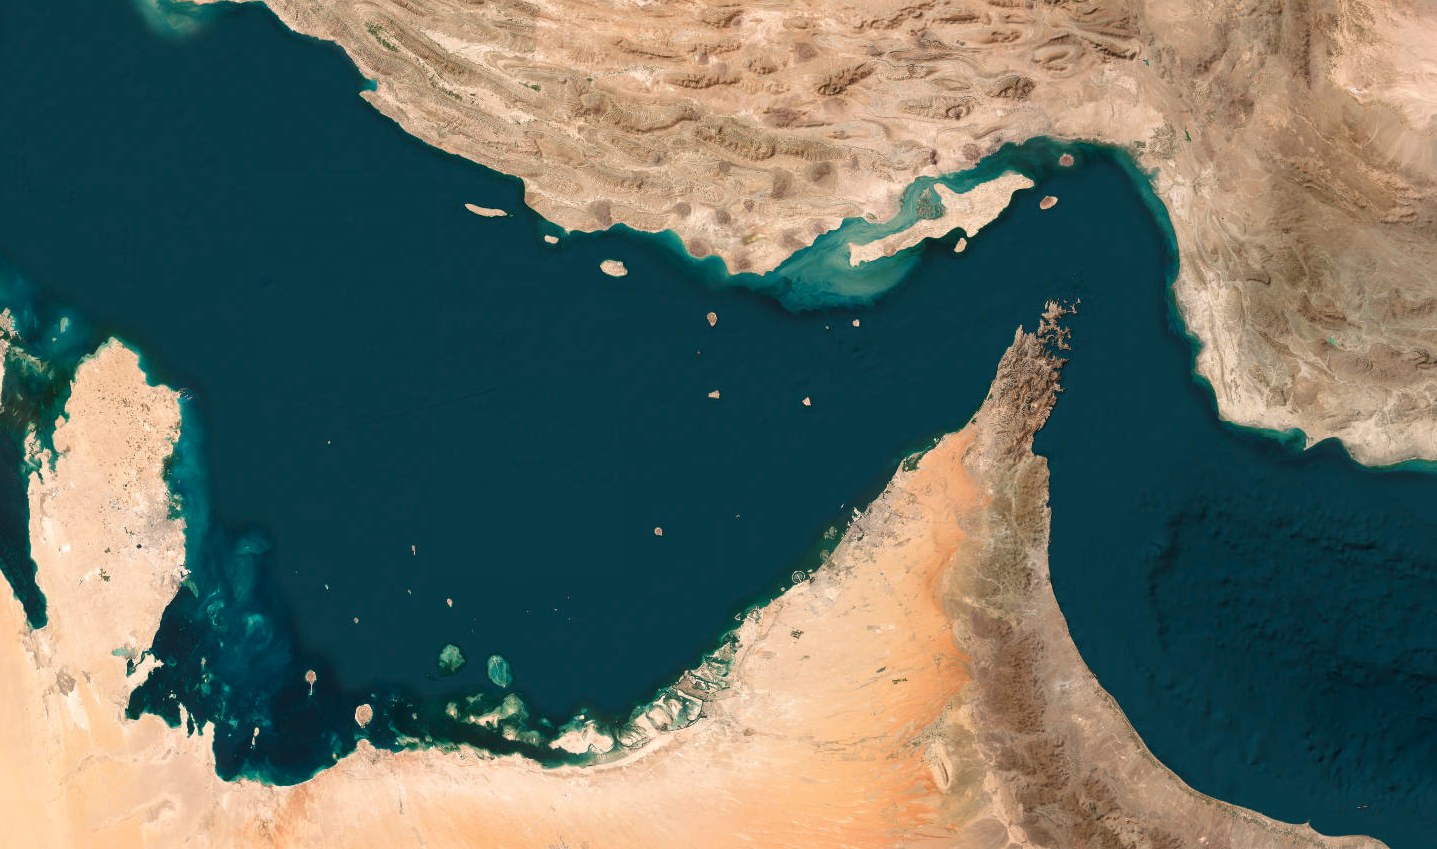
Source for the four index figures: WTO-AXSMarine Strait of Hormuz Trade Tracker.
Zero means different things for different commodities.
The WTO-AXSMarine Strait of Hormuz Trade Tracker's three export series, crude oil, LNG, and fertilizer-related products, have all converged on the same figure this month: a 7-day moving average of zero. This is the flattest export record since the closure began. But zero transits through the strait does not mean the same thing for all three commodities. Crude, LNG, and fertilizer have each adapted in different ways, and the implications for dependent importers are different.
The grind to zero took six months. September is when it finished.
All three series collapsed hard within the first four to six weeks of the closure, from a pre-closure baseline near 100 (each indexed to its own January-March 2025 average) into the single digits by April. In spite of regular announcements of memoranda of understanding and near-deals, none of the three ever recovered. Each kept grinding down through the summer (fertilizer: 7.5 in June, 6.6 in July, 2.0 in August; crude: 3.0 in July, 1.4 in August; LNG down to 0.9 in August), and September is the first month that grind has bottomed out completely. Fertilizer's zero run is unbroken since 23 August. Crude's started on 26 August. LNG's started earliest, 14 August.
Read as one number, this looks like total, undifferentiated collapse. But there are two other factors at play: whether a physical alternative exists for the commodity, and what the tracker is actually measuring.
A barrel that never enters the strait was never counted to begin with.
The WTO-AXSMarine tracker is built on AIS vessel-tracking data inside the strait. A barrel that never enters the strait does not register as a missed export. It is never counted as strait traffic to begin with — a limitation we've written about at more length in Hormuz and the Limits of the Index.
Saudi Arabia's East-West Pipeline, known as Petroline, runs 745 miles from the Eastern Province to Yanbu on the Red Sea, with a maximum capacity of 7 million barrels a day. Since the closure, Saudi Arabia has pushed the pipeline close to that ceiling. Roughly 5 million barrels a day of crude now moves out through Yanbu, plus 700,000 to 900,000 barrels a day of refined products. About 2 million barrels a day more feed domestic refineries sited along the pipeline's western terminus, chiefly at Yanbu and Rabigh; those refineries draw from the same pipeline flow. The result is that Saudi Arabia is reportedly still reaching roughly 85% of its pre-war export volume in normal conditions, almost entirely rerouted around the strait rather than through it. That figure held through most of the seven months, but it is not a fixed number, as September showed.
The UAE has a smaller but real version of the same option: the Habshan-Fujairah pipeline to the Gulf of Oman coast currently carries around 1.8 million barrels a day, with an expansion underway that would roughly double it to 3.6 million barrels a day, against pre-war UAE exports of about 3.4 million barrels a day. That expansion is targeted for operational status in 2027.
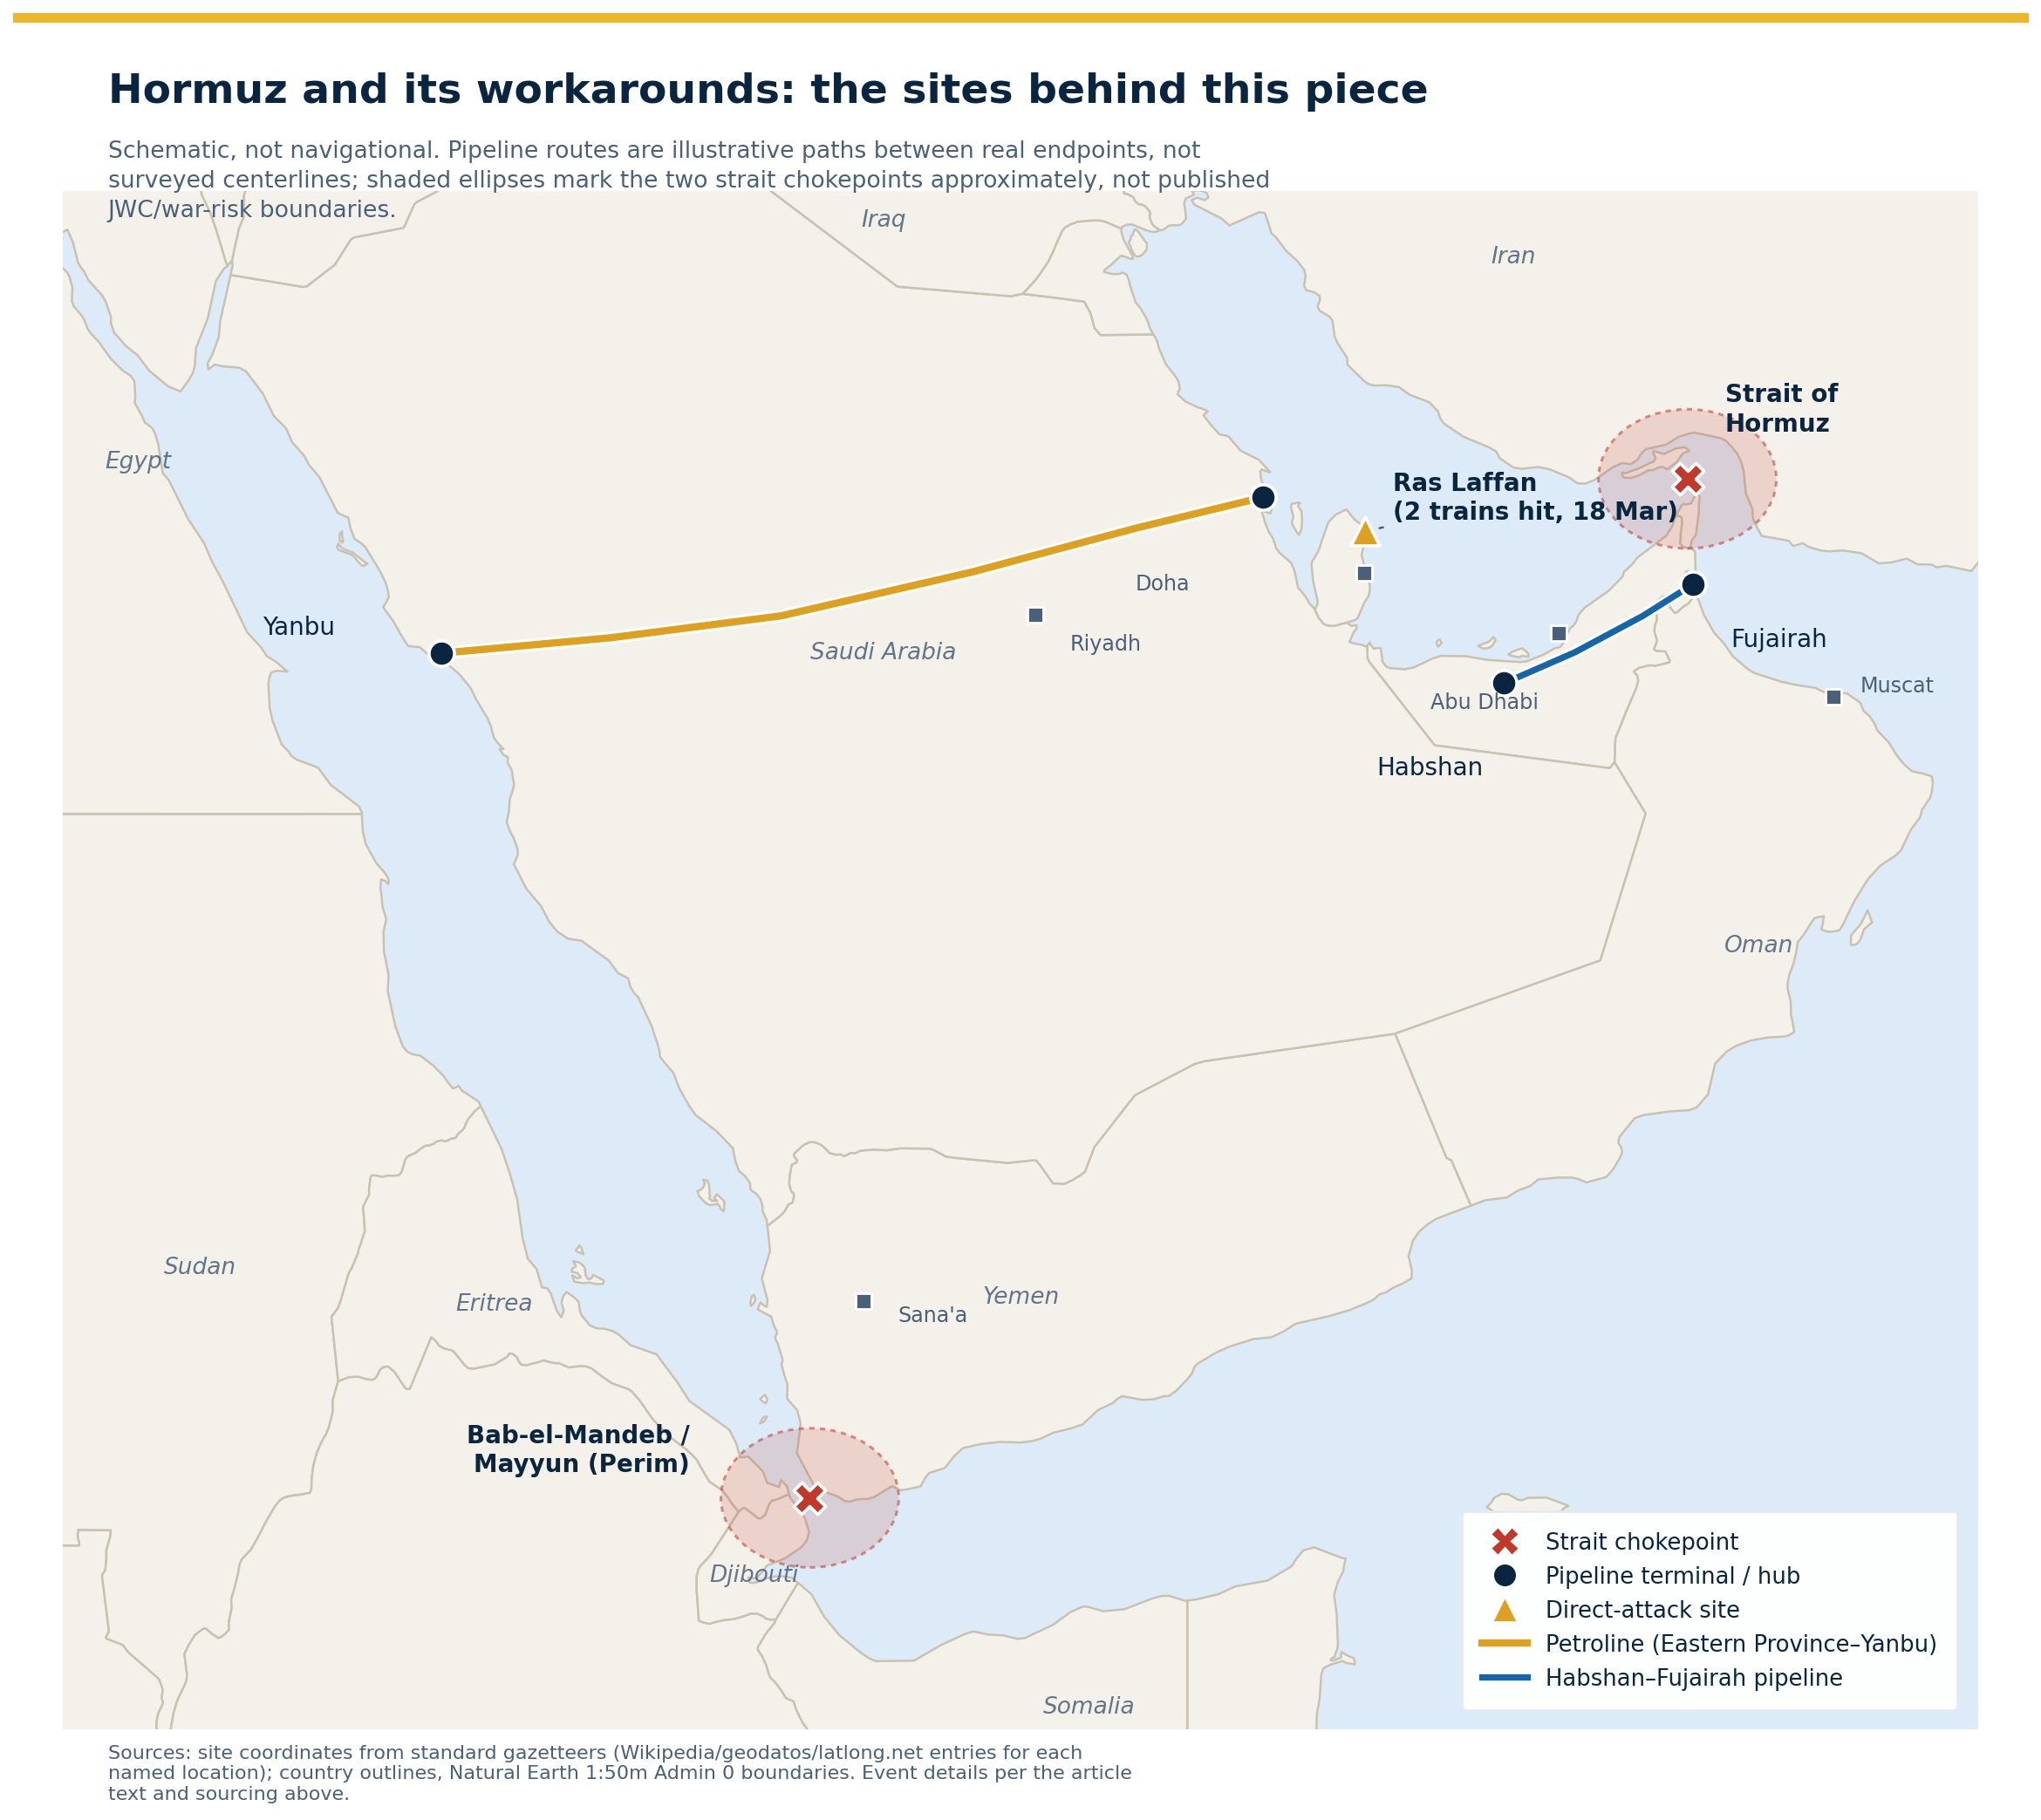
Why is not all crude routed this way as a matter of course, closure or not? Pipeline capacity is the binding constraint: Petroline's 7 million barrel ceiling and the Fujairah line's current 1.8 million fall well short of full Gulf export volume even combined, so the pipelines cannot carry everything regardless of preference. Loading directly at a Gulf terminal is also normally the shorter, cheaper voyage for cargo bound east, so producers use the pipeline mainly for cargo genuinely bound west or as a hedge. What has changed since February is the price of the alternative: VLCC freight to China has reportedly reached roughly $30 a barrel, close to a quarter of the total delivered cost of the barrel, which is what has pushed Saudi Arabia to run Petroline near its physical ceiling. We go deeper on where the rerouted barrels actually end up, and who it does and doesn't reach, in The Rebalancing Is Real. It Does Not Reach Everyone.
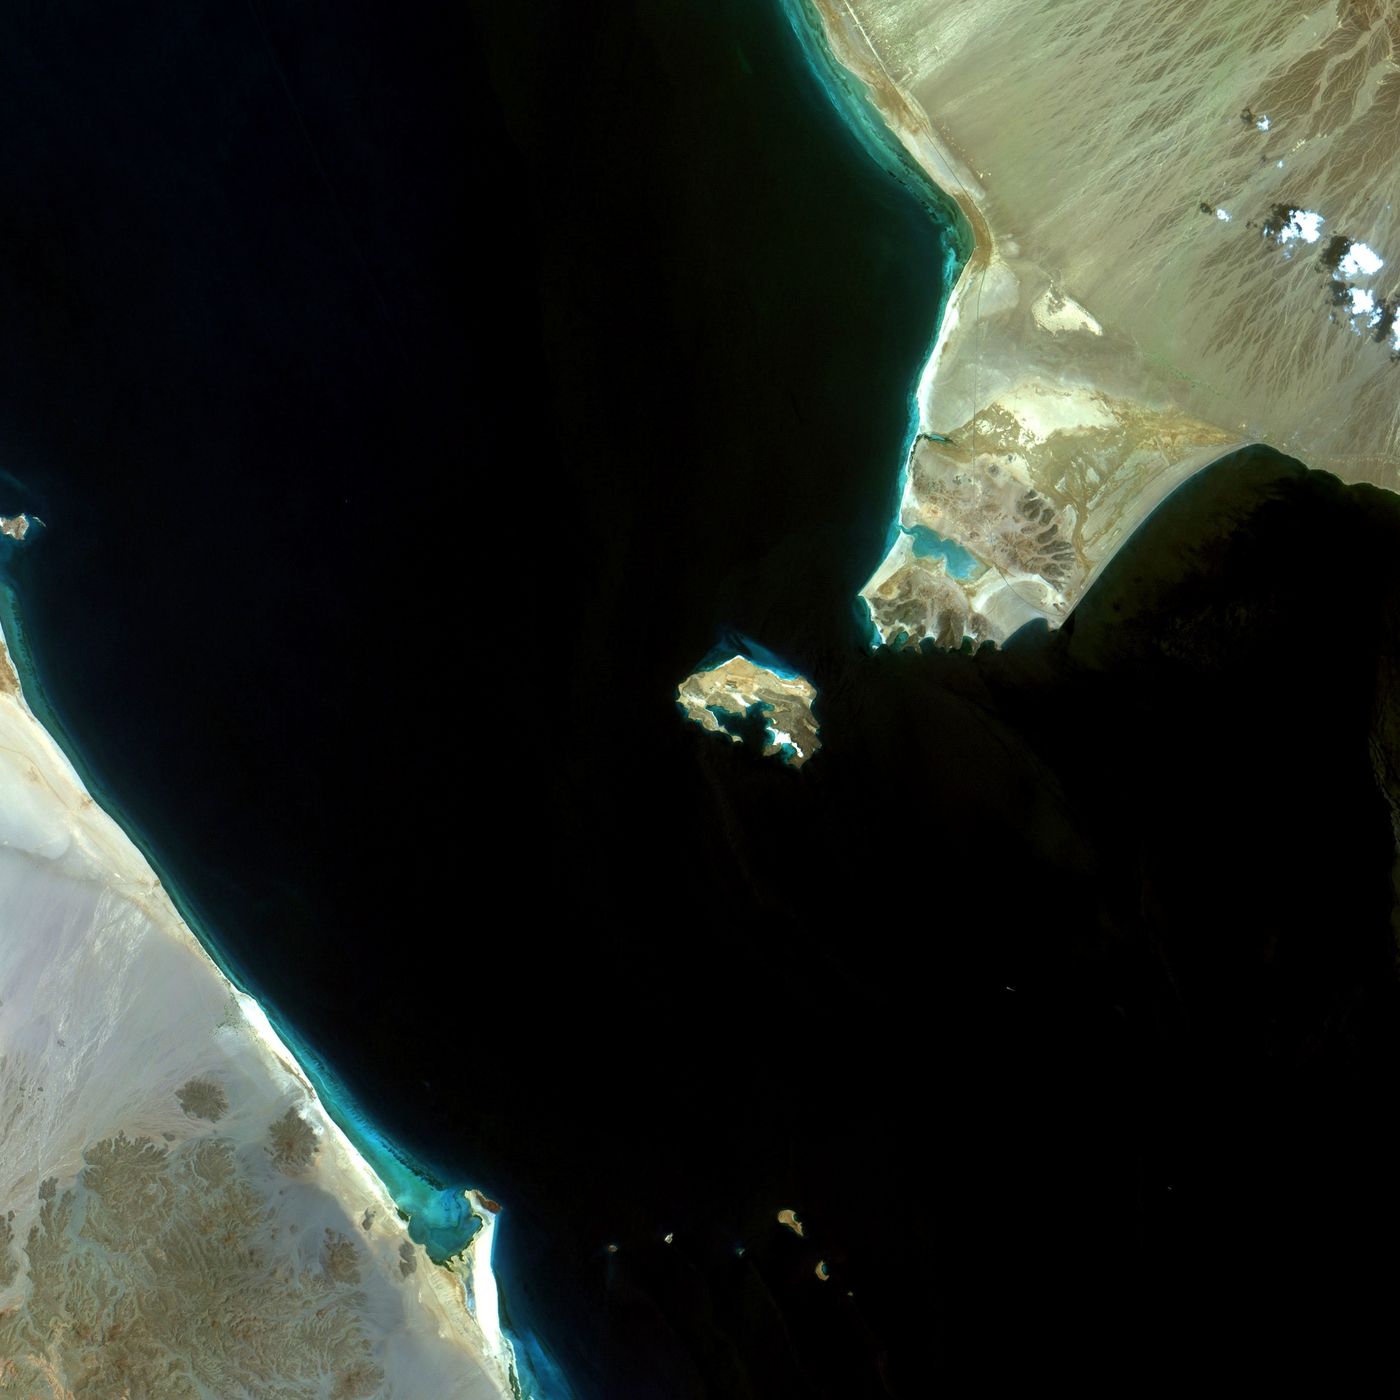
A meaningful share of the zero in the crude series is probably attributable to alternative routing. Barrels that used to transit Hormuz are now leaving from Yanbu and Fujairah instead, invisible to a strait-transit tracker. That routing is not itself free of risk: drone strikes hit Petroline itself on 10 and 11 September. Saudi Arabia shut the pipeline as a precaution, taking an estimated 4 to 5 million barrels a day of bypass capacity offline. Within a day, Houthi forces seized Mayyun (Perim) Island, challenging the security of the Bab-el-Mandeb strait, the same corridor that Yanbu-loaded cargo depends on to reach the Red Sea and beyond. For two and a half weeks, the strait and its main bypass route were both compromised at once. Petroline came back on line around 28 September at roughly 3.5 million barrels a day. Diverting around Hormuz does not mean diverting into a risk-free corridor, or even a fixed one. It means trading one designated risk for a different one.
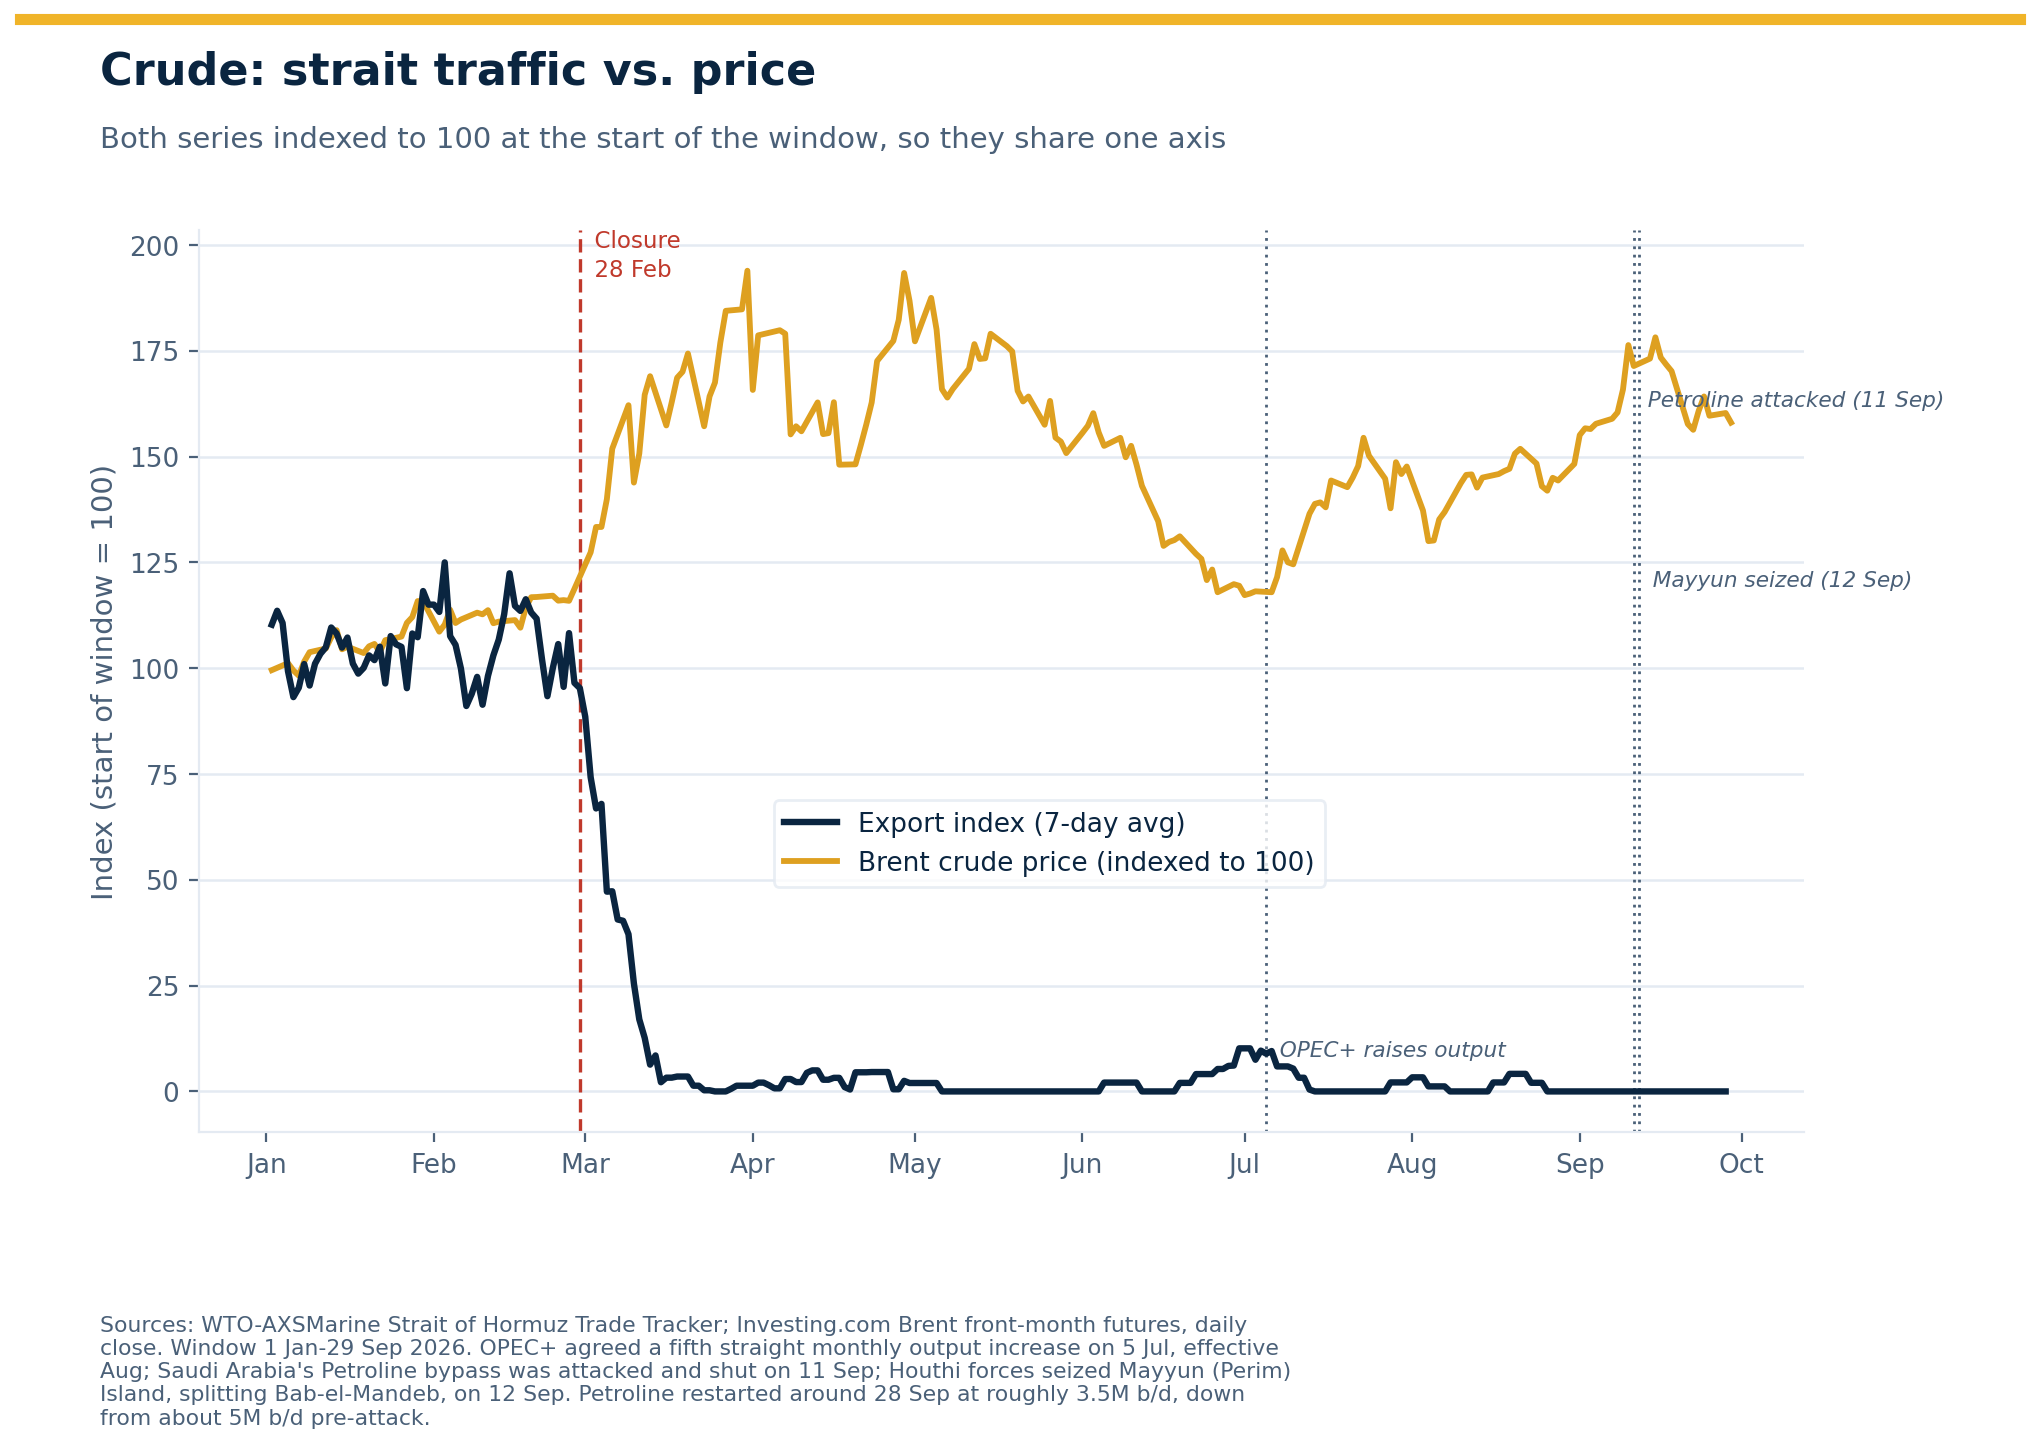
The price data backs up the routing explanation, and adds a wrinkle. Brent prices jumped on the initial closure, as expected, but after that first month the two series decouple entirely: Brent prices swooped from a roughly 118 dollar April and May peak down to about 72 in July and back to around 108 by September, while the export index stayed pinned near zero the whole time. Brent is a global benchmark blending many crude streams, so this is not a contradiction, but it does mean price action after the first month cannot be read as a live signal of Hormuz-specific supply. The market has not spent seven months pricing a full physical stoppage of Gulf crude, which is consistent with the pipeline-bypass and dark-transit picture above.
The two big swings in the second half of the window both trace to identifiable events, not to Hormuz-specific supply news. The July trough coincides with OPEC+ agreeing a fifth consecutive monthly output increase alongside both OPEC and the IEA cutting their 2026 demand growth forecasts and a large US crude inventory build in early August. The September climb is different: it lines up with the Petroline attack and the Mayyun seizure described above, the closest this window comes to the market visibly pricing a Hormuz-adjacent supply risk, briefly, before easing back as Petroline resumed flowing.
Pipeline bypass only works for a liquid that can move overland.
Pipeline bypass works for crude because crude is a liquid that can move overland. It does not work for LNG or for solid bulk fertilizer.
LNG must be liquefied at the export terminal and moved by purpose-built LNG carriers. There is no overland pipeline substitute for liquefied gas at export scale. Qatar is the dominant supplier behind most Gulf LNG volumes and it lacks a meaningful alternative export route: no pipeline bypass exists at anything near LNG export scale, and building one would require years and heavy capital. Two Ras Laffan liquefaction trains were hit in a direct attack earlier this year, removing about 17% of Qatar's total export capacity, with repairs reportedly requiring three to five years. Qatar's undamaged capacity remains around 64 million tonnes a year. The constraint is export: cargo has queued and been turned back at the strait, more than 25 energy companies have declared force majeure since the war began, and Qatari LNG exports are not expected to return to pre-war normal even once Hormuz reopens.
Fertilizer is a solid bulk commodity with the same overland problem: urea, ammonia, and sulphur move by bulk carrier, and there is no pipeline equivalent for solids. Unlike LNG, fertilizer's shortfall appears to be a mix of two things. Reporting indicates Gulf urea production itself has been disrupted, with one estimate suggesting more than half of the Middle East's urea output has been lost since the war began, attributed in part to strikes on energy and industrial infrastructure that feed fertilizer plants. Separately, other reporting describes real, if unquantified, volumes of already-produced fertilizer stranded in the Gulf awaiting available ships.
Zero on the tracker; not zero for whoever is on the other end of the trade.
The Narrows Chokepoint Dependency Model ranks real 2024 bilateral trade exposure by importer for each commodity that transits Hormuz. Read against the export collapse, it reveals who is actually exposed — the question Iran Can Hold Out. Here Is Who Pays. asks at the country level across the whole crisis; this is the commodity-by-commodity version of the same question.
| Importer | Exposure | Hormuz dependency |
|---|---|---|
| China | $113B | 34.6% of crude imports |
| India | $60B | 42.3% |
| Japan | $57B | 79.1% — highest in the group |
| South Korea | $55B | 63.9% |
Crude oil (HS 2709). Given the pipeline-bypass picture above, practical exposure for these importers is very likely smaller than a literal zero would suggest. Petroline and Fujairah together cap out short of full pre-war Gulf export volume, and whatever gap remains will probably be affecting the highest dependency-ratio importers, Japan and South Korea, hardest per barrel even where China and India show larger dollar totals.
| Importer | Exposure | Hormuz dependency |
|---|---|---|
| China | $11B | 24.7% of LNG imports |
| South Korea | $6.9B | 23.4% |
| Pakistan | $3.5B | 82.3% — by far the highest in this table |
LNG (HS 271111). These dependency percentages describe marine-borne imports specifically, not total energy supply from all sources. Pakistan has no meaningful land-based gas alternative currently in service: the long-discussed Iran-Pakistan pipeline remains stalled over sanctions risk, and the rival Turkmenistan-Afghanistan-Pakistan-India line remains unbuilt. Given LNG's lack of a pipeline-bypass option, Pakistan appears to be carrying that exposure with no structural alternative visible in this data.
Fertilizer. Sri Lanka (65.8%) and Thailand (53.0%) are the most exposed importers by share, and India (26.6%) the largest by value: about $1.55 billion a year of its urea comes from the Gulf, but more than half of that is Omani and loads outside the strait. The Narrows Chokepoint Dependency Model shows that none of the three have a viable alternative supplier, unlike Brazil, the US, and Mexico, which the model flags as having substitution options with a 30-45 day lag. Two of the world's other major fertilizer exporters have pulled back this year specifically because of this crisis. China has restricted roughly 50-80% of its phosphate export volume since March, citing the need to protect domestic supply after Hormuz disrupted global trade, and Russia is separately limiting nitrogen and phosphate volumes through its own quota system. For India, Thailand, and Sri Lanka, two conditions are hitting at once: the corridor they depend on most is at zero, and the backstop suppliers the rest of the market leans on are themselves constrained, for the same underlying reason. China's restraint has not been uniform across nutrients, though: phosphate stayed restricted, but China reversed course on nitrogen, reopening urea exports in late May after having held them back since March.
The same three importers, as a picture. Each bar is one country's total fertilizer import bill, set to 100%, so length compares composition, not market size — the reliance this whole piece is about:
Hormuz-dependent shares are the corrected CDM figures (India's was restated on 5 October 2026: an earlier 48.4% included Russian-origin urea that the model had wrongly routed through Hormuz). The gold and blue segments are illustrative splits of each country's remaining import bill, shown to scale the Hormuz share against the total rather than to claim a precise sourcing breakdown for the non-Hormuz portion.
This is a food-security question, not only a shipping one.
This is where the fertilizer collapse turns into a food-security question rather than a shipping one, and the exposure runs through major grain and protein producers themselves, not only through the countries most commonly discussed as food-insecure.
The United States imports 95% of the potash it uses, though the bulk of that, 79%, comes from Canada largely by rail rather than by sea, with Russia (12%) and Israel (3%) making up most of the rest and arriving by ship. Nitrogen and phosphate are far less import-reliant for the US, at 13% and 16% respectively. Brazil is a different case entirely: imports covered 88% of Brazil's total fertilizer consumption in 2025, with potash at 96%, nitrogen at 95%, and phosphate at 72%, and unlike the US case, Brazil's supply (from Canada, Russia, Belarus, and Morocco among others) arrives overwhelmingly by sea. One estimate puts the Strait of Hormuz's normal share of global fertilizer shipments at up to 30%, and roughly a third of global fertilizer trade as disrupted by this conflict in some form. Brazil is a top global exporter of soybeans and corn, so a fertilizer-cost shock reaching Brazilian farmers has food-price implications that extend well beyond Brazil's borders.
Reach continues beyond grain producers into other import-dependent regions. Sudan's Gulf-sourced fertilizer dependence is around 54%, the highest single-country exposure found in this research, and Bangladesh at 53.3%, applying the highest nitrogen-per-hectare usage rate among the countries covered, meaning it has the least margin to simply use less. The exposure is not limited to staple grains either: fertilizer-dependent cash crops in import-reliant growing regions carry the same input-cost risk, as already noted in Narrows' earlier Hormuz Has a Fertilizer Problem Too, which cited reporting on Cote d'Ivoire cocoa farmers going into the season short of fertilizer.
Urea, ammonia, and phosphate feed directly into the cost of the next planting season, and a fertilizer shock shows up with a lag, at the point farmers are buying inputs for the next crop. Given fertilizer's flatline has now run 5.5 weeks with no substitution option for the most exposed importers, and the usual secondary suppliers are simultaneously tightening for a related reason, the input-cost pressure on India, Thailand, Sri Lanka, Brazil, Sudan, and Bangladesh's next planting cycles looks less like a temporary disruption to absorb and more like a supply picture with no clear near-term relief valve.
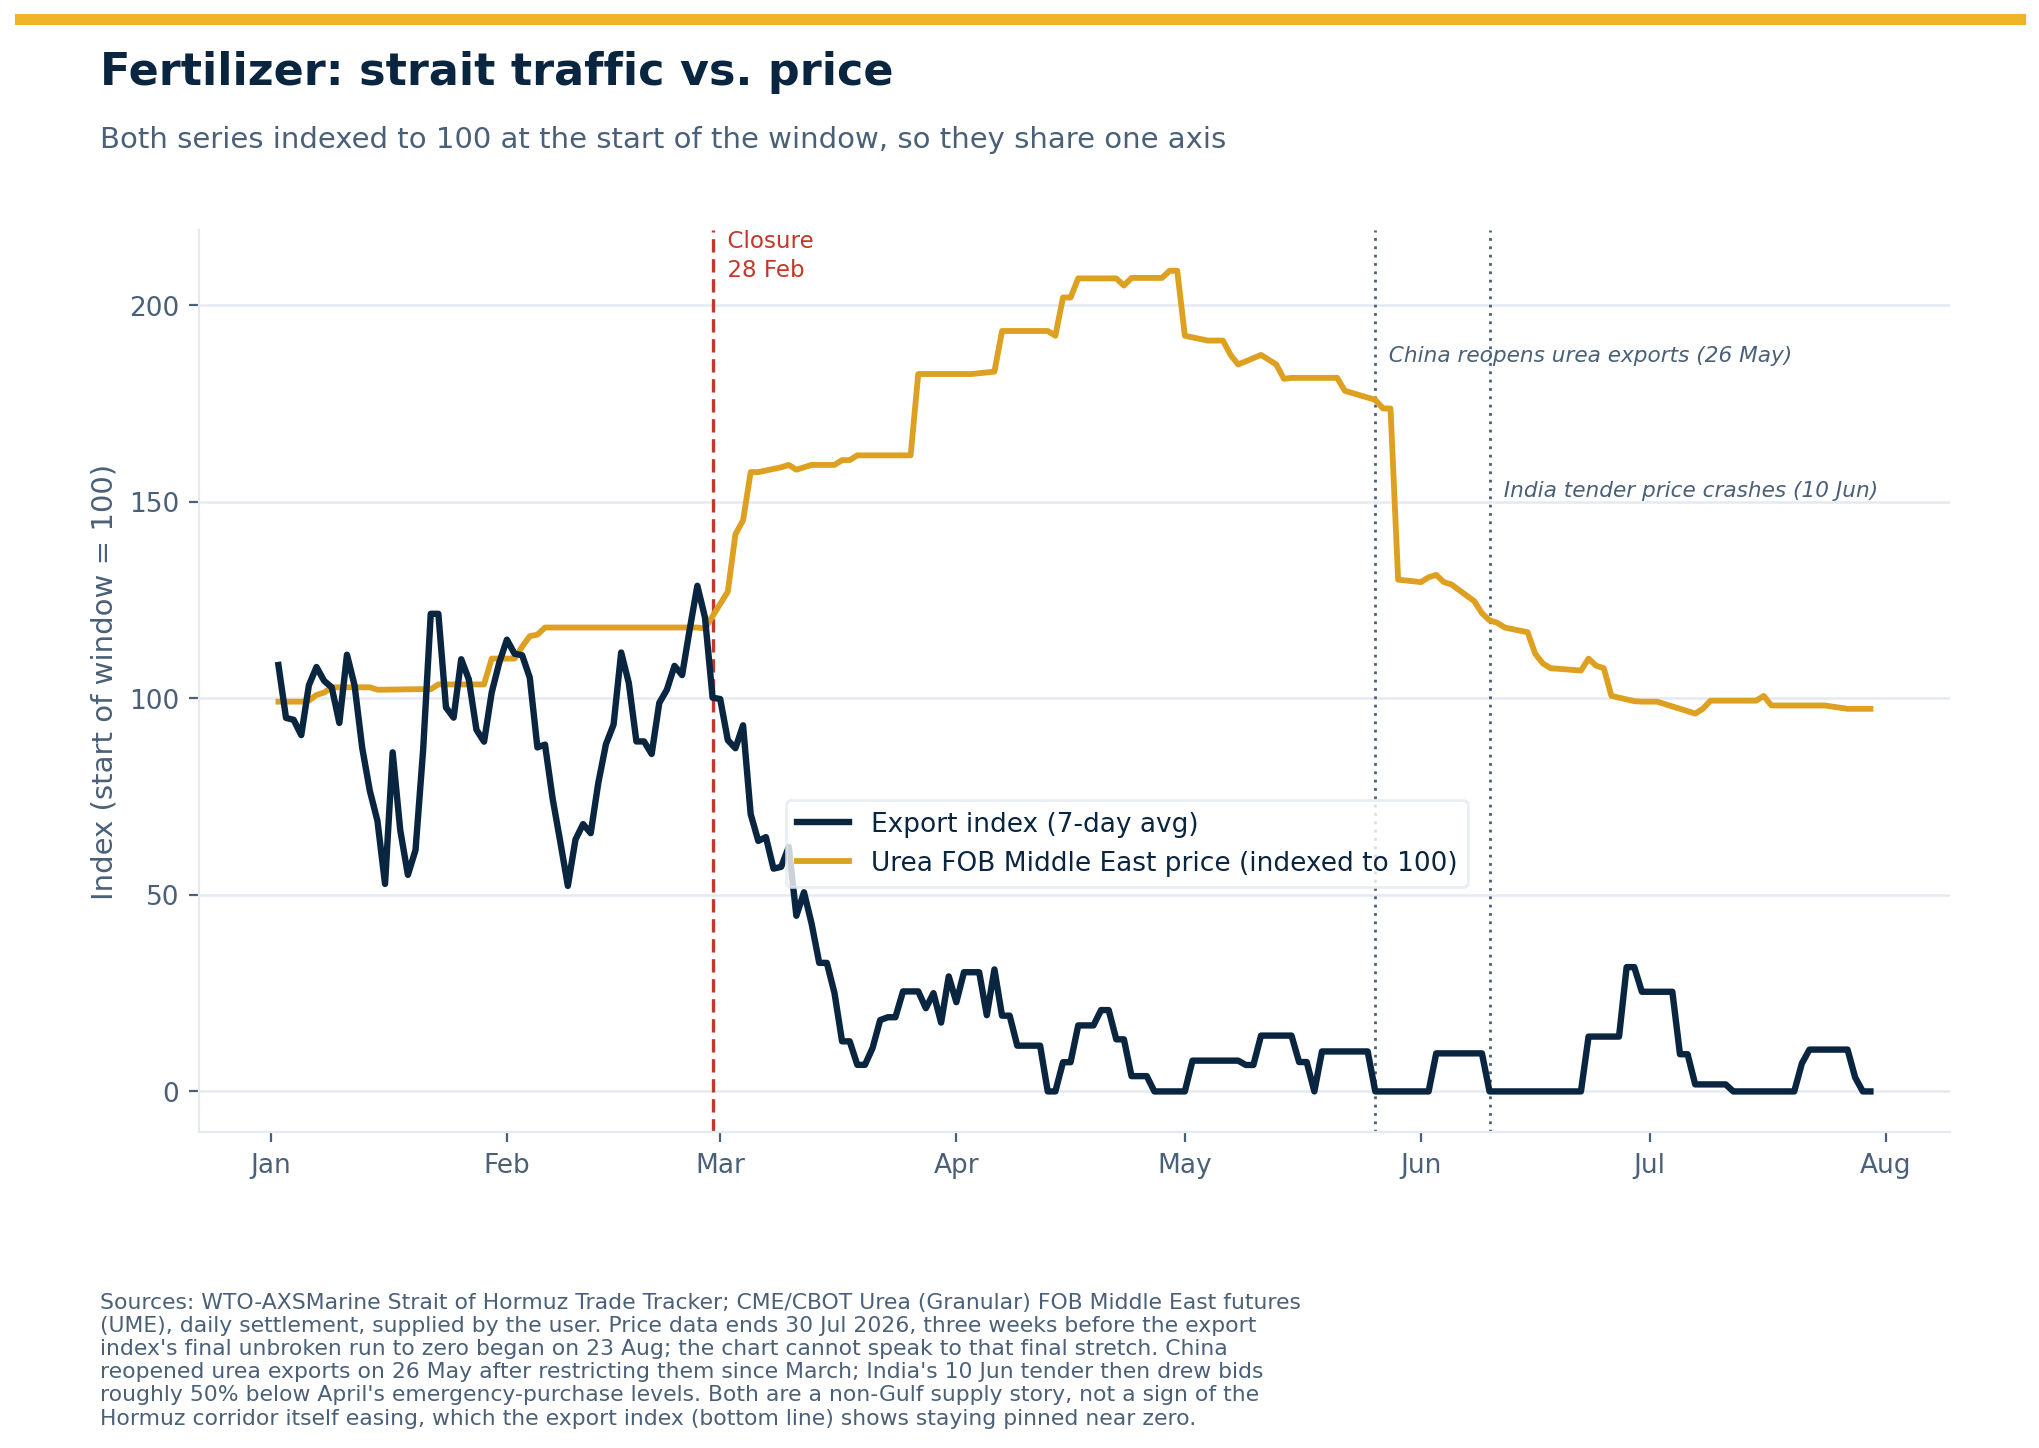
On pricing itself: a futures and spot market exists for this, unlike for most of the corridor-level metrics elsewhere in this piece. CME/CBOT lists Urea (Granular) FOB US Gulf futures (ticker UFV) and a separate FOB Middle East contract (UME). The chart below plots the FOB Middle East contract against the fertilizer export index over the same window. Price rises through March and April as exports collapse, in line with what the export data alone would predict, but then falls for two straight months, back near its pre-closure level by late July, while exports stay pinned near zero the entire time. Price and physical export volume decouple well before the export data's own window ends, the same pattern as the crude chart above, and the urea data does not extend past 30 July, three weeks before the export index's final run to zero began, so it cannot say whether that decoupling held once the stoppage became total.
The decline itself is a China supply story, not a Hormuz story, and it is worth being precise about which China. China's phosphate restrictions, noted above, tightened supply and pushed the other direction. Urea moved the opposite way. Beijing had throttled urea exports since March as well, but reversed that stance on 26 May, setting export price floors of $660 a tonne FOB for prilled urea and $670 for granular, and allocating 1.5 to 1.6 million tonnes for June through August. The market felt it almost immediately: when India's National Fertilisers Limited floated a 1.7 million tonne tender on 10 June, it drew roughly 6.24 million tonnes in competing offers from about 34 suppliers, and the lowest bids came in around $445 to 449 a tonne, versus the $935 to 959 a tonne India had paid in an emergency April purchase at the height of the crisis. A seasonal lull after the Northern Hemisphere spring application window, plus Brazil pulling back on purchases because its own planting cycle had already concluded, added to an already oversupplied market. None of this reflects an easing of the Hormuz-specific squeeze on the corridor itself, which the export index shows staying at zero. It reflects a different, non-Gulf supplier stepping into the gap that China's own earlier restriction had helped create.
Zero is not one story.
For crude, it is largely a measurement artifact: the barrels are still moving, just around the tracker rather than through it, at a cost and a risk that briefly became very real when Petroline itself came under attack in September. For LNG, zero is close to the literal truth, a genuine capacity loss with no bypass and no fast repair. For fertilizer, zero sits on top of a market that is still finding its own price level independent of the closure, pulled down through the summer by a Chinese nitrogen-export reversal that had nothing to do with Hormuz, even as China's phosphate restrictions pulled the other way.
What ties the three together is not the export index. It is what each zero forces someone else to absorb. Japan and South Korea carry crude exposure with the least practical pipeline relief per barrel. Pakistan carries LNG exposure with no structural alternative at all. India, Thailand, Sri Lanka, Sudan, and Bangladesh carry fertilizer exposure into a planting season where the usual backstop suppliers are themselves constrained, for reasons that trace back to the same closure. Seven months in, the strait's most durable effect may not be the zero on the tracker, but the fact that the costs of avoiding that zero, in pipeline capacity, in freight, in a second chokepoint's own war risk, have quietly been reassigned to whoever had the least room to absorb them.