Every chokepoint
has a number.
Most desks do not have it.
Dollar-denominated exposure, rerouting cost, and fleet-at-risk data.
Built for the underwriters, traders, and lenders who need to put a number on it.
37 corridors modelled. Bilateral dependency to HS-code level. Run it before the disruption, not during it.
All commodities · Sensitivity 1.00 · Cape rerouting only · 2024 data
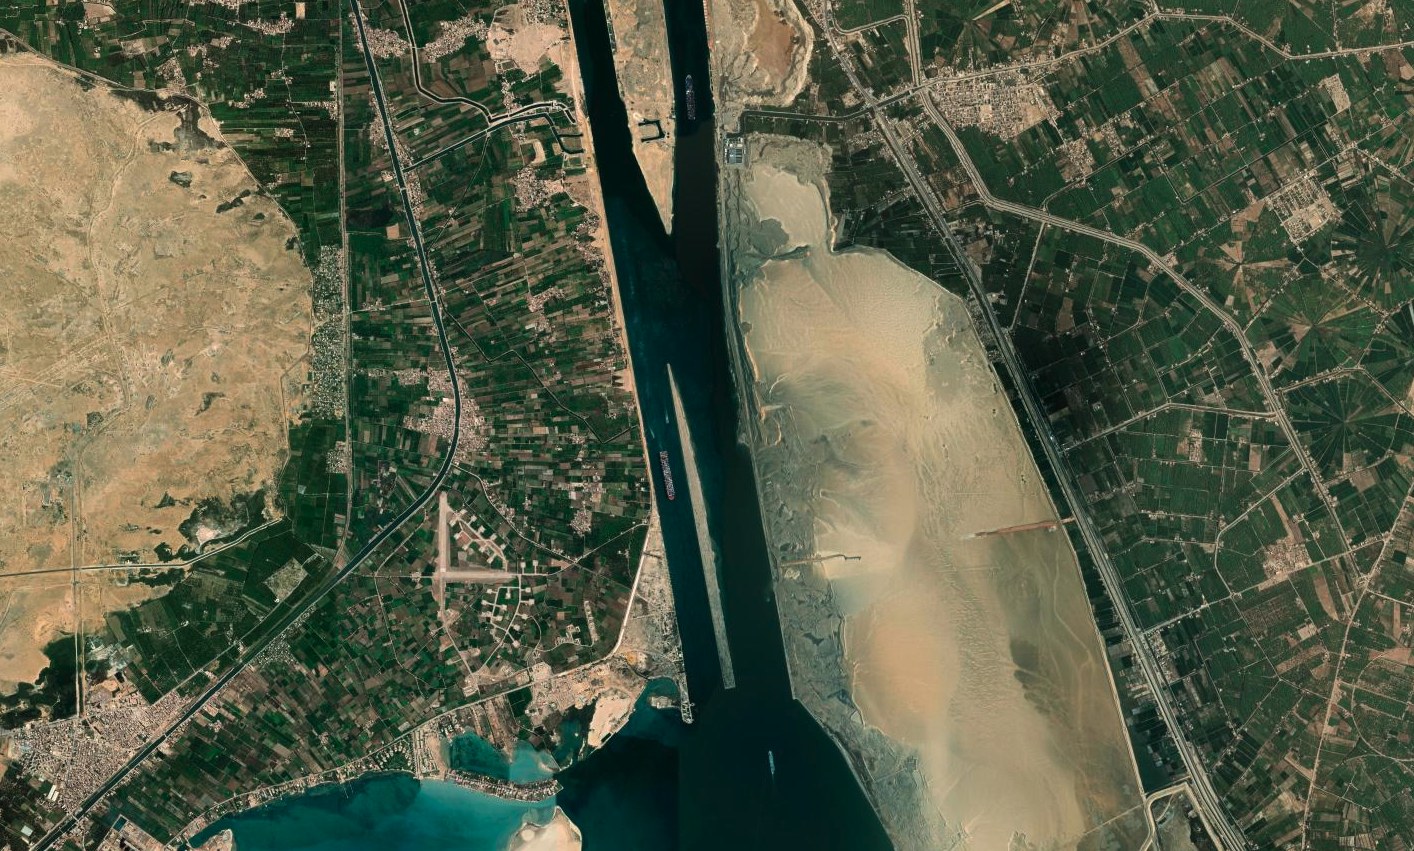 Suez Canal · 193 km · 12% of global trade
 Built for the people whose decisions depend on getting the number right.
The model runs your scenario in front of you, with your assumptions, on your corridor of interest.
Accumulation underwriters
Your accumulation model tracks hull. The Narrows adds the cargo dependency layer. Which commodities, from which origins, through which corridors, at what bilateral dependency percentage? The fleet-at-risk output is your accumulation number.
Hormuz: sustained closure · in-Gulf fleet accumulation modelled per vessel class and cargoCommodity trading desks
A crude desk with open positions through Hormuz needs the rerouting cost and delivery delay before pricing the risk. That is not a tail risk, it is a live pricing input. The model runs your vessel class, your rates, your corridor.
Malacca closure: +4 days · $800k voyage overrun per SuezmaxProject finance teams
Voyage cost overrun and carrying cost outputs map directly to debt service coverage analysis. Model what a corridor disruption does to freight assumptions in a 15-year financing structure.
Suez 14d: $1.4M voyage overrun · 5% p.a. carrying cost basisSupply chain risk managers
Understand your raw material dependency on specific trade corridors before the disruption, not during it. The bilateral dependency percentage is the basis for a procurement hedge, not just a risk register entry.
South Korea: 81% crude via Malacca · 73% crude via Hormuz3,778 ports scored.
Across four dimensions of risk.
The Narrows Port Risk Index applies an INFORM-style composite methodology to every major port in the World Port Index. Physical accessibility, operational reliability, trade concentration, and political stability: each scored, each decomposable, one composite number per port.
| Rank ↕ | Port | Country | PRI ↓ | D1 | D2 | D3 | D4 |
|---|---|---|---|---|---|---|---|
| 3,778 | Aden | Yemen | 3.64 | 1.5 | 6.7 | 2.6 | 6.6 |
| 3,803 | Nueva Gerona | Cuba | 3.12 | 5.9 | 5.9 | 1.5 | 1.8 |
| 3,802 | Puerto Cabezas | Nicaragua | 2.94 | 6.3 | 5.0 | 2.0 | 1.2 |
| 2,515 | Durban | South Africa | 1.29 | 0.5 | 4.3 | 3.4 | 0.4 |
| … | |||||||
| 1 | Jurong Island | Singapore | 0.71 | — | — | — | — |
Every assumption is a conversation,
not a constraint.
If your view of bypass capacity, vessel rates, or corridor sensitivity differs from our defaults, that is a one-parameter change. The demo runs your scenario, in front of you, with an analyst present. No sales funnel. A person will reply.