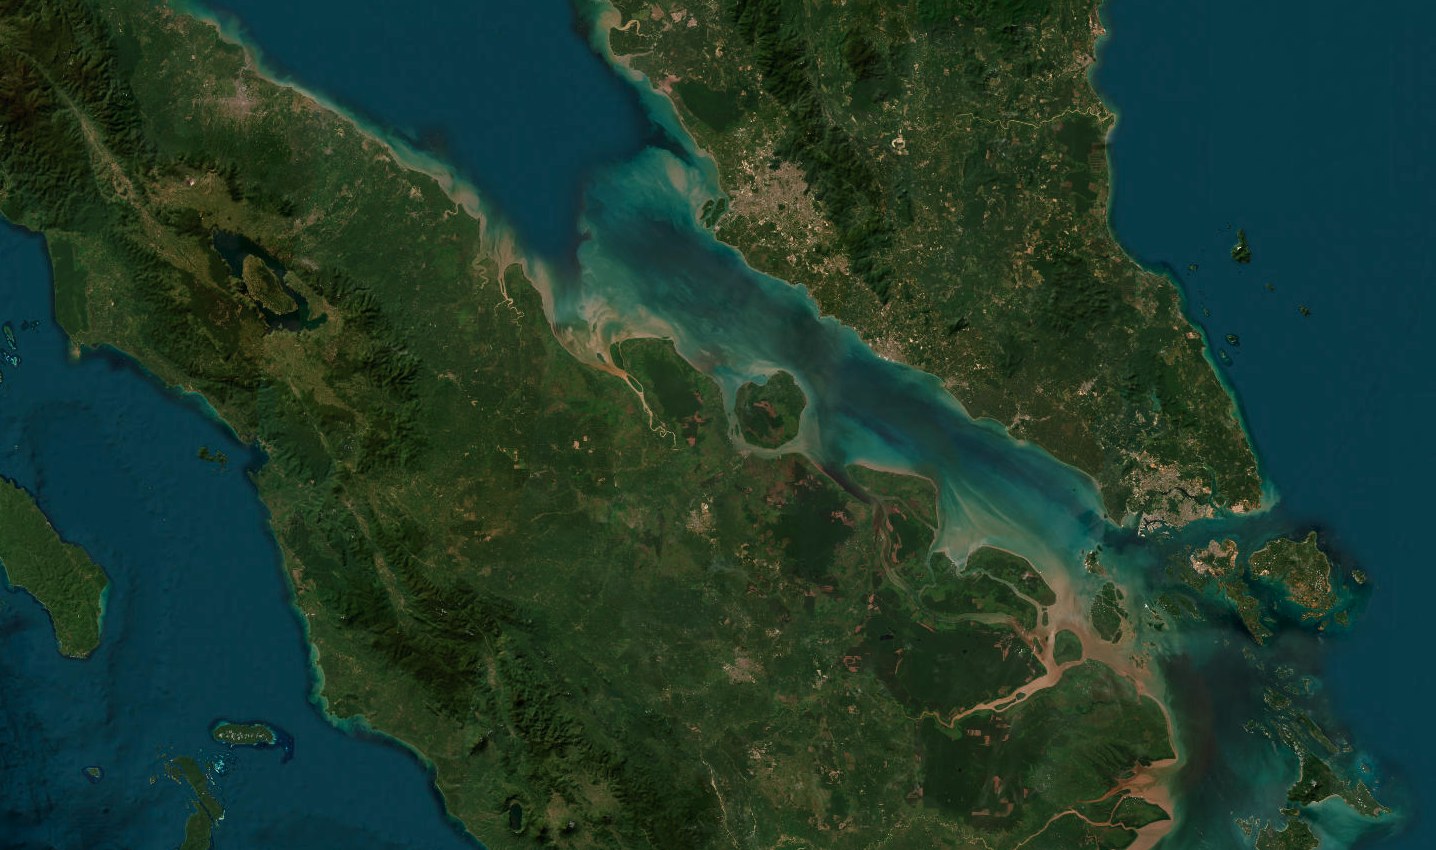
The figure appears in serious places. It measures the wrong thing.
The claim that roughly 80 percent of China's oil imports transit the Strait of Malacca has circulated in risk analysis for over two decades. The volume data underlying it is real: the EIA's World Oil Transit Chokepoints report (last updated March 2026) puts Malacca tanker throughput at approximately 17 million barrels per day, more than any other maritime chokepoint. Cross-referencing that volume with China's seaborne crude import scale produces the 80 percent inference. The figure is then reproduced as a standalone dependency statistic across a wide range of published analysis.
Vol. 39, Dec 2011
Paszak, Feb 2021
Foundation, 2024
These are credible sources. The figure they are reporting is real. It is a routing figure: it counts the percentage of China's seaborne oil imports that physically pass through the Strait of Malacca on their journey to port. The Narrows Chokepoint Dependency Model (CDM) produces a different number because it asks a different question.
The CDM figure of 46.2 percent is a structural dependency figure: it counts the share of China's seaborne crude petroleum imports that face genuine supply disruption if Malacca closes, after accounting for vessels that could divert to the Lombok Strait at a cost. These two quantities differ by approximately 34 percentage points. The gap is a rerouting option, not a data discrepancy.
Where China's crude comes from, and which routes each origin actually requires.
The throughput figure becomes easier to understand when you look at China's crude import origin mix alongside the routing options available from each origin. China's seaborne crude supply comes from four broad origin clusters, each with a distinct set of chokepoints and bypass options on its path to Chinese ports.
| Origin cluster | Approx. share | Typical routing | Malacca? |
|---|---|---|---|
| Middle East Gulf Saudi Arabia, Iraq, UAE, Kuwait | ~42% | Hormuz → Indian Ocean → Malacca or Lombok | Alternatives exist |
| Russia: ESPO Kozmino terminal, Pacific coast | ~20% | Pacific direct to Chinese ports | No |
| Russia: Ural seaborne Black Sea export, small volume | ~5% | Bosphorus → Suez or Cape → Indian Ocean → Malacca or Lombok | Alternatives exist |
| West Africa Angola, Nigeria, Congo | ~18% | Cape of Good Hope → Indian Ocean → Malacca or Lombok | Alternatives exist |
| Americas via Panama US, some Colombia | ~8% | Panama Canal → Pacific direct | No |
| Americas via Cape Brazil, others southbound | ~7% | Cape of Good Hope → Indian Ocean → Malacca or Lombok | Alternatives exist |
The critical routing correction concerns West Africa. West African crude bound for China does not take an independent Pacific route: it rounds the Cape of Good Hope into the Indian Ocean and must then transit an Indonesian strait to reach the South China Sea. The choice is Malacca or Lombok, not Malacca or nothing. The same applies to seaborne Russian Ural crude and Brazilian crude routed via Cape. Only ESPO crude (Pacific direct from Kozmino) and Americas-via-Panama cargo genuinely bypasses the Malacca zone entirely.
This means the origin diversity in China's crude import book does not reduce Malacca relevance by as much as a simple geographic split would suggest. West Africa's share of China's crude book adds to the Malacca-or-Lombok traffic, not to a separate non-Malacca stream. What reduces China's structural dependency below 80 percent is not origin diversity per se, but the availability of Lombok as a viable alternative to Malacca for the same cargoes.
Lombok handles 21.6 percent of China's crude. That traffic is at risk, but it is not trapped.
The Lombok Strait, 400 km east of Malacca, is navigable by laden VLCCs. It handles deep-draft vessels excluded from Malacca's 25-metre depth limit and adds approximately four days to a voyage from the Indian Ocean to Chinese ports. At current VLCC day rates, that represents roughly $268,000 in voyage cost overrun per transit.
The CDM shows that 21.6 percent of China's seaborne crude currently routes via Lombok rather than Malacca. That traffic represents $70.6 billion in annual trade value and it is already using the bypass. If Malacca closes, this 21.6 percent continues to arrive. A Malacca closure does not affect cargo already on the Lombok path. Including it in a Malacca dependency figure overstates the corridor's leverage by the full 21.6 percentage points.
| Corridor | Structural dependency | Annual VaR | Bypass status |
|---|---|---|---|
| Strait of Malacca | 46.2% | $151.1B | Lombok viable · +4 days · $268k/voyage |
| Strait of Lombok | 21.6% | $70.6B | Malacca (reverse) or Sunda (partial draft limit) |
| Strait of Hormuz | 37.7% | $123.3B | No alternative exit for laden VLCCs from the Gulf |
| Luzon Strait | 11.8% | $38.6B | Partial: routing-dependent |
| Bab el-Mandeb / Suez | 0.6% | $1.9B | Cape of Good Hope |
The table also makes visible a risk that the 80 percent figure can obscure: Hormuz carries higher structural dependency for China's crude book than is commonly paired with the Malacca figure. Middle Eastern crude that currently transits Malacca first exits the Persian Gulf via Hormuz. Hormuz has no viable bypass for laden VLCCs. Malacca does. A model that overstates Malacca exposure at 80 percent may simultaneously be undersizing the Hormuz component of the same cargo's exposure profile.
India illustrates the contrast directly. India's crude import book runs through two entirely separate chokepoint corridors with no shared geography: the Hormuz exit for Gulf crude (~49% of seaborne supply) and the Bosphorus plus Suez/Bab el-Mandeb corridor for Russian Ural crude (~38%). A Malacca-first framing misses both. The India exposure profile below is structural: closing either corridor disrupts supply independently.
Vietnam and the Philippines carry genuine near-total Malacca dependency. China does not.
The CDM does produce very high Malacca dependency figures. They apply to different countries than the ones most commonly cited in Malacca Dilemma analysis. Vietnam carries 87.0 percent structural crude dependency on Malacca. The Philippines carries 95.3 percent.
The reason is import origin concentration, not routing geography. Both Malacca and Lombok are physically accessible from the South China Sea approaches used by Vietnamese and Philippine ports. The distinction from China comes from the supply side: Vietnam and the Philippines import almost exclusively from Middle Eastern Gulf producers, with minimal volumes from Russia, West Africa, or the Americas. China's import book is diversified across all four origin clusters, meaning a substantial share of its crude never approaches Malacca regardless of events in the strait. Vietnam's and the Philippines' books carry no comparable offset.
A secondary factor is vessel class and port access. Laden VLCCs exiting Lombok and routing north toward Vietnam must add the Karimata or Makassar straits to their path, adding incremental distance relative to Malacca that is proportionally less attractive than for China's northern ports at Qingdao or Dalian.
What the CDM shows is that near-total Malacca dependency is real, but it belongs to Vietnam and the Philippines, not China. Vietnam sources virtually all of its crude from Middle Eastern Gulf producers. There is no meaningful alternative supply base and no credible short-term substitution route. The Philippines presents the same structure: refinery configuration and port depth constraints at Limay and Batangas mean that close to 95 percent of crude import value flows through Malacca with no viable bypass. This is the framing that rarely appears in Malacca Dilemma coverage, which defaults to China as the headline exposure.
| Country | Malacca dep. | Annual VaR | Character of exposure |
|---|---|---|---|
| Philippines | 95.3% | $3.7B | Near-captive: Gulf origin concentration, ports adjacent to South China Sea entry |
| Viet Nam | 87.0% | $6.3B | Near-captive: Middle East origin concentration, limited non-Gulf supply diversification |
| Indonesia | 35.0% | $3.7B | Split: western ports (Malacca side) vs. eastern ports (Lombok/Makassar side) |
| China | 46.2% | $151.1B | Diversified: multi-origin book dilutes Malacca exposure; Lombok bypass material |
The correct read is not that Malacca is less important than two decades of analysis suggest. Malacca handles extraordinary volumes of cargo and a closure would cause severe harm across the region. The correct read is that the harm is not distributed as the 80 percent figure implies. China faces a serious Malacca event at 46.2 percent exposure, not 80 percent. Vietnam and the Philippines face a genuine near-closure scenario that rarely appears in the same analytical frame.
China LNG via Malacca: 61.2 percent. The bypass calculus is harder than for crude.
The crude bypass correction rests on Lombok's viability as an alternative route for laden VLCCs. For LNG, the routing alternative is more constrained and the supply substitution problem is materially harder.
Large LNG carriers, particularly Q-Flex and Q-Max vessels transporting Qatari gas, already avoid Malacca due to draft constraints at peak load. These vessels transit the Lombok or Ombai-Wetar straits as a matter of routine. However, the LNG counted as Malacca-dependent in the CDM comes primarily from Southeast Asian export terminals: Malaysian facilities at Bintulu in Sarawak, and Australian northwestern shelf terminals routing northward. These facilities export LNG through the passages east and north of the Malacca corridor. A Malacca closure creates routing friction for carriers in the strait at the time and for southbound positioning voyages, but the more durable problem is supply substitution.
Unlike crude oil, LNG is not fungible at scale. Receiving terminals in Japan, South Korea, and China are engineered for specific supply specifications and contractual volumes. The global LNG spot market carries insufficient liquidity to replace significant contracted Malacca-corridor supply within the timescale of a closure measured in weeks. An LNG carrier can reroute via Lombok; an importer cannot replace contracted Australian or Southeast Asian volumes from Atlantic Basin sources within the same window. The supply chain risk for LNG is therefore more persistent than the routing risk alone.
| Country | Malacca dep. (LNG) | Annual VaR | Supply substitution |
|---|---|---|---|
| Rep. of Korea | 61.1% | $17.9B | Contracted supply · no spot substitution at scale |
| Japan | 50.3% | $20.8B | Contracted supply · no spot substitution at scale |
| China | 61.2% | $27.3B | Contracted supply · limited spot substitution |
The LNG figures for all three major North Asian importers cluster between 60 and 65 percent. Unlike the crude dependency numbers, these figures do not carry a meaningful bypass correction. The Lombok bypass exists as a routing option; it does not resolve the supply availability problem. For accumulation purposes, the LNG component of Malacca exposure should be treated as harder than the crude component.
What the correct figure does to the reserve calculation.
An underwriter sizing a treaty layer on Chinese crude exposure with an 80 percent Malacca dependency assumption is applying a structural factor 73 percent higher than the CDM bilateral figure. The implied PML is wrong in the same direction. The difference in implied 14-day VaR for China crude between the two assumptions is approximately $4.2 billion, applying the 33.8-percentage-point gap to an implied total seaborne crude book of roughly $327B. In a reinsurance treaty, that is a structural mispricing, not a modelling tolerance.
The CDM framework treats Malacca exposure in three distinct buckets:
Genuinely captive
Cargo from origins with no viable routing alternative to Malacca: specific Southeast Asian LNG supply chains, and crude origins where the Lombok detour is not commercially or operationally viable. A Malacca disruption is a supply halt for this cargo. Full severity applies.
Economically captive
Cargo that could reroute via Lombok at a cost that, below a threshold disruption duration, makes Malacca transit preferable. Above approximately 10 days of closure, Lombok becomes commercially rational. This cargo faces rerouting cost, not a supply halt.
Origin-diversified
Chinese crude from ESPO and Americas-via-Panama origins that does not approach the Malacca zone. A Malacca event does not affect this supply at all. It contributes nothing to Malacca accumulation regardless of what dependency figure is applied.
The 46.2 percent figure covers Buckets 01 and 02 combined. The fraction in Bucket 01 alone is smaller still. The 80 percent figure collapses all three buckets into a single number, treating Bucket 03 as Malacca-exposed and Bucket 02 as having no bypass. Both assumptions are wrong in the same direction, and they compound.